Wednesday, March 31, 2010

Burketown - But Which One Is It?

Burketown (029004 - [data] [graph]) is the representative station for Queensland District 2 (Gulf Country) in the Australian RCS Network. In the RCS, this station goes by the name "Burketown Post Office", but it is difficult to find in the underlying BoM data.

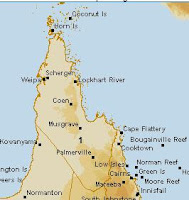
A look at the map shows that there are (apparently) eight stations in the Gulf Country District:

029012 - Croydon Township - [data] [graph]
029038 - Kowanyama Airport - [data] [graph]
029039 - Mornington Island - [data] [graph]
029063 - Normanton Airport - [data] [graph]
029077 - Burketown Airport - [data] [graph]
029139 - Sweers Island - [data] [graph]
029167 - OZ Century Mine - [data] [graph]

Plus the eighth station that goes by the name "Burketown".

But - where is this "Burketown" station? It doesn't show up on the list of stations on the Queensland Weather Observations page. And if we click on the "Burketown" legend on the map, it takes us here:


A non-station, apparently. But given that the data starts in 1890 for 029004 - Burketown PO, the assumption is that "Burketown PO" and "Burketown" are one and the same station. But would you bet the house on it?

After looking at the data for the rest of the stations in this District, the answer is "probably not". Here is a brief summary of the discrepancies between Station start date and Data start date for the remaining seven stations (oldest to newest):

029012 - Croydon Township. Station date: 1889; Data date: 1912 (23 years missing)
029139 - Sweers Island. Station date: 1893; Data date: 2001 (108 years missing)
029038 - Kowanyama Airport. Station date: 1912; Data date: 1965 (53 years missing)
029039 - Mornington Island. Station date: 1914; Data date: 1972 (58 years missing)
029063 - Normanton Airport. Station date: 2001; Data date: 2001
029077 - Burketown Airport. Station date: 2001; Data date: 2001
029167 - OZ Century Mine. Station date: 2003; Data date: 2003

Clearly, apart from the first station (029012 - Croydon Township), the remaining stations are useless for assessing long-term climate trends. They give a whole new meaning to "the dog ate my homework".

Consequently, the choice for the RCS representative station comes down to two candidates, geographically separated by 290km:

A) 029012 - Croydon Township. A station with a 98-year history, albeit one with data missing from the middle years, which shows a pronounced cooling trend over the period:


B) 029004 - "Burketown Post Office". A poorly-sited station of questionable origin (which doesn't appear in the day-to-day list of weather stations), but does profess to have a slightly longer data history (again with missing data in the middle). And does indicate a period of warming between 1950-1990.


Answer: Let's go with the "Dodgy Post Office" - the one that can have a warming "signal" teased out of it.

Summary:
The data from the stations in the No. 2 Queensland District are a shambles, to say the least. Across all the stations, there are no continuously unbroken data history prior to 1990, which means that any contribution to "climate records" from this District is - at best - guesswork. There also appears to be very little quality control of the basic station records - "Burketown" and "Burketown PO" seem to be used interchangeably. And finally, when in doubt about which station to include in the RCS, the default position appears to be to select the one that indicates a warming trend - however tenuous.

Tuesday, March 30, 2010

More Dodgy Post Offices

A couple of posts ago, we looked at a collection of six very dodgy stations - mostly located in or around post offices or sites near the centre of towns.

In today's post, we look a further selection of five equally dodgy stations - they are:
  1. 010592 - Lake Grace PO (WA) - [data] [graph]
  2. 017031 - Marree (SA) - [data] [graph]
  3. 029004 - Burketown PO (QLD) - [data] [graph]
  4. 030045 - Richmond PO (QLD) - [data] [graph]
  5. 046037 - Tibooburra PO (NSW) - [data] [graph]
010592 - Lake Grace Post Office

This station is listed in the BoM RCS Listing as "Lake Grace Post Office", but in the detailed station record as "Lake Grace Comparison". At any rate, the BoM "official" photograph for this site speaks for itself:


Here we can see that the station is located next to a well maintained railway line, and partially in the shade of a large tree.

017031 - Marree

Again, this station is listed in the RCS Listing as "Marree", but in the detailed station record as "Marree Comparison". Like the station above, the "official" photograph speaks for itself.


Hard to know from the photograph if this is an active station, or just parked here with the rest of the junk.

029004 - Burketown PO

I can only conclude that they sent the 'Airport Photographer' to capture this image. It shows the station sitting in what looks like a wide open space, complete with shady trees:


Until we look at the location with Googe Earth, that is:


And then we see that it is at the intersection of two streets, and across the road from a large paved area. If only the photographer had stood at the other end!

030045 - Richmond PO

Again, the "official" image shows a wide open, rural space - even with a bit of shade.


Google Earth - a completely different aspect:


Not quite the perspective you get from the first image.

046037 - Tibooburra PO

The pick of the bunch - but then I guess it would be hard to dress up this shot.


Again, you have to remind yourself that this is a "high-quality" station, collecting reliable data about the "State of the Climate".

Summary:
The two "Dodgy Post Offices" posts detail eleven stations (out of a total of 103 RCS stations) that have, shall we say, less than optimal placement. On rudimentary examination of the "official" BoM photographs and Google Earth, none of them appears to meet CRN1 specifications. And yet the BoM and CSIRO feel comfortable in making the assertion that "all of Australia has experienced warming over the past 50 years". Extraordinary.

Sunday, March 28, 2010

Weipa? Why Weipa?

It is hard to understand how Weipa Airport (027045, [data], [graph]) qualifies as a RCS station with "high quality and long climate records".

Presumably the fact that it is located at an airport gives it preferential treatment:
  • 51 of the 103 stations (49.5%) in the RCS Network are located at airports or airstrips
  • 11 of the 18 RCS stations (61.1%)  in Queensland are located at airports or airstrips
  • 60 of the 134 stations (44.8%) currently active in Queensland are located at airports or airstrips
However - for the Peninsula District of Queensland (which includes Weipa Airport), 7 of the 8 active stations are located at airports or airstrips, so the chances of selecting an airport for the RCS station are high.

The other seven stations in Peninsula District are:

027054 - Coconut Island - [data] [graph]
027058 - Horn Island - [data] [graph]
027073 - Coen Airport - [data] [graph]
027075 - Scherger RAAF - [data] [graph]
028004 - Palmerville - [data] [graph]
028007 - Musgrave - [data] [graph]
028008 - Lockhart River Airport - [data] [graph]


On the surface of it, Weipa Airport seems to meet none of the qualifications for a "high quality, long term" station.

1. It is sited next to an airstrip


2. It is missing most of its data


3. But for the few years that it has been collecting data, it does have a slight warming trend.


Of the remaining airport stations, five (027054 - Coconut Island, 027058 - Horn Island, 027073 - Coen Airport, 027075 - Scherger RAAF, 028004 - Palmerville) have less years of data than Weipa Airport, and are therefore less suitable candidates.

The sixth (028007 - Musgrave) has most of its data missing, and is therefore even less suitable.


028008 - Lockhart River Airport has far more years of data than Weipa Airport, but unfortunately it would seem to support a different narrative - namely 40 years of temperature stability:
 
By far the best candidate is the remaining non-airport station, 028004 - Palmerville. Its qualifications are:

1. Situated in a rural location, with no apparent contamination from human habitation or machinery:


2. A long term, almost complete set of data:


3. Unfortunately, like Lockhart River Airport, it also tells the wrong narrative - over a century of temperature stability:


Summary:
Weipa Airport could not be more untypical of the stations that the RCS claims to represent, namely "high quality, long term" records. The only two stations in this District which, on the surface of it, appear to more fully satisfy these requirments have been passed over - presumably because they support a different narrative. Unless there is another explanation, this would appear to be blatant cherry-picking of the worst kind. But then - why hasn't this been picked up by the "peer review"?

Saturday, March 27, 2010

More Holes than a Swiss Cheese

It seems that looking at the effective data start date is not the only yardstick by which to evaluate the BoM "high quality" RCS stations. It is also necessary to graph the data to look for the additional holes in the data.

In the previous post, we noticed that several stations had data missing for 40 or more years beyond their notional commencement date. One of the stations looked at was 008039-Dalwallinu, which has a notional start date of 1912, but a data start date of 1955 - or 43 years of missing data. Upon closer examination it appears that the continuous data start date is actually 1957. A closer look again shows that there is missing data for 1970 as well, which clearly shows on the graph of the data:


There are several stations that have incomplete data in the early years, including:
As bad as they are, the sample above are by no means the worst of the bunch. Several of the stations have large gaps in the middle of the data as well, including:

014508 - Gove Airport - [data] [graph]


017043 - Oodnadatta Airport - [data] [graph]


063005 - Bathurst Agricultural Station - [data] [graph]


200790 - Christmas Island Airport - [data] [graph]


... and even 300000 - Davis Station - [data] [graph]


Summary
As noted in the previous post, there are 32 RCS stations that have data missing from the beginning of the dataset. From this analysis, we see that there are 22 RCS stations that have data missing beyond the initial start date. Eight of these RCS stations are in the same list as the previous post, which means that there is a total of 46 RCS stations (or a staggering 44.6%) that have significant missing data.

In the HARRY_READ_ME.txt file from the CRU ("Climategate") files, the author of the READ_ME makes the following telling comments:

"getting seriously fed up with the state of the Australian data. so many new stations have been introduced, so many false references.. so many changes that aren't documented."
"Now looking at the dates.. something bad has happened, hasn't it. COBAR AIRPORT AWS cannot start in 1962, it didn't open until 1993!"
"I am very sorry to report that the rest of the databases seem to be in nearly as poor a state as Australia was."
It is very hard to disagree with these comments. In this and the last two posts it has become apparent that:
  • Cunderdin station has been summarily dropped out of the RCS network and substituted by Cunderdin Airport (with no documentation to indicate the change).
  • Many stations exhibit the same problems as "Harry" observed with Cobar Airport
  • Over 44% of the stations have sigificant amounts of data missing - in a number of cases, enough to make the data that is left unusable.
One does not have to be a rocket scientist to appreciate the frustration that "Harry" must have gone through in attempting to make sense of the RCS data. How bad is the RCS data? It's all hidden in plain view for anyone who takes the time to look.

Thursday, March 25, 2010

Where has all the data gone ?

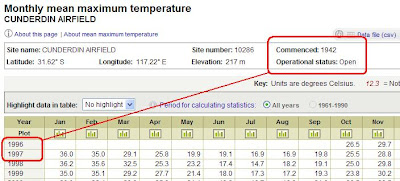
As noted yesterday, the BoM temperature data for the "new" Cunderdin station (010286 - Cunderdin Airfield) begins at 1996, while the station record indicates that the station commenced in 1942.


Apparently, there are 52 years worth of data missing from the record for this "new" Cunderdin station.

Which begs the question - is this a unique occurence, resulting from the late-night changes at the BoM to substitute station 010286 for the inconvenient Cunderdin station 010035?

A look at the listing of RCS stations on the BoM site shows that there are 103 "high quality" stations in this network. They have notional station start dates ranging from 1860 through to 2003, with 65% of them having a notional start date prior to 1969. Overall, the average notional station start date is 1950.

However, when you look at the data start date, a different picture emerges. For openers, 32 of the stations (32%) have a data start date which is later than the station start date by more than a year, or have significant gaps in the data in the early years.

Some of these missing years of data are considerable - several are in the order of the 52 year gap noted for Cunderdin, above. For example:

008039 - Dalwallinu Comparison. [data] [graph]
Station date = 1912, Data date = 1955 (43 years missing)


010592 - Lake Grace PO. [data] [graph]
Station date = 1914, Data date = 1956 (42 years missing)


017031 - Marree Comparison. [data] [graph]
Station date = 1885, Data date = 1939 (54 years missing)


And several more in addition to these.
 
The net effect of all this missing data is that for these 103 stations, the oldest station data start date moves forward by 4 years (to 1864), while the average station data start date moves forward by 9 years (to 1959).
 
Where's the Beef?
 
Just how "high quality" are the stations in the RCS network? What is the overall impact on the derived climate record of all these missing years? With so much data from the early years missing, how can anyone make a valid long-term climate assessment? Is this RCS data of any practical value at all?

Wednesday, March 24, 2010

Where did Cunderdin Go?

An all-time favourite quote of mine comes from "Alice in Wonderland":
'When I use a word,' Humpty Dumpty said in rather a scornful tone, 'it means just what I choose it to mean -- neither more nor less.'
And so it is with the BoM and - I would guess - with most institutions engaged in promoting the greater man-made global warming narrative.


Last week, I downloaded the list of RCS stations from the BoM website. Included in this list was the following station:
10035 - CUNDERDIN
 
This station, and its accompanying photograph, was included in the "Dodgy Post Offices" blog entry early this week, which in turn was given air time on the Andrew Bolt blog. This apparently has instigated a response from the BoM (via the Andrew Bolt blog), as follows:
At Cunderdin, parallel observations between the two sites took place between 1996 and 2007. Temperature observations ceased at the old site in 2007 and 10286 is now the only temperature measuring site in the area. The photo displayed on Andrew Bolt’s blog, in any case, is not the pre-2007 site - it is a rainfall-only site which continued under the 10035 site number at a different location after temperature observations ceased.
So, in simple terms, while the BoM documentation states that temperature data is (and has been) gathered from one station, it has in fact been gathered from a second station before being moved to a third station.
 
And who knew this - apart from the BoM, that is?
 
Today, the list of RCS stations on the BoM site no longer includes 10035, and in its place we have this entry:
10286 - CUNDERDIN AIRFIELD
 
So, it would seem that history can simply be rewritten at the stroke of a mouse - the visible public record can be altered in the middle of the night, with nothing to indicate that changes have taken place. Nothing on the station site record indicates the anecdotal history described above. An older site has simply been replaced by a newer site.
 
Which raises the question: how has the temperature data for this 10286 site been sourced or reconstructed? The 10035 Cunderdin station lists a start date of 1914. The 10286 Cunderdin Airfield station lists a start date of 1942, but the BoM website only appears to have data from 1996 onwards - which is in line with the BoM comments noted above. Where are the missing years? And more importantly, how can this 13 years of data support the CSIRO+BoM assertion that "since 1960 the mean temperature in Australia has increased by about 0.7 °C"?
 
Perhaps a more appropriate quote for the pursuit of Climate Science comes from George Orwell's "1984":
'Who controls the past controls the future: who controls the present controls the past'.
For the record, here is a view of the "new official" Cunderdin Airfield station:


And it would probably surprise no-one to learn that this new Cunderdin Airport station exhibits a warming trend:


Which in turn looks almost nothing like the one that it replaced (10035):


I think I am beginning to understand where their "about 0.7 °C mean temperature increase" comes from.

Tuesday, March 23, 2010

Townsville Airport - A Case in Point

A comment we see thrown around quite a lot these days is: "Does it really matter if a weather station is located at an airport? Surely all this gets lost in the background noise." Well, let's look at Townsville Airport, and see what we can learn.
  1. 032040 - Townsville Airport (FNQ) - [data] [graph]
Townsville Airport (1940)

Firstly, the obligatory BoM "rural scene" photograph of the Townsville Airport weather station:


Followed by the Google Earth view of the same:


As can be seen from this image, Townsville is anything but a "non-urban" location. It is a coastal city in Far North Queensland, and has a population (2008) of ~176,000, having grown from ~98,000 in 1981.

In addition, Townsville Airport is anything but the "rual" airstrip shown in the BoM image above. According to the history of Townsville Airport, the following significant activites can be noted:
  • 1958 - the present 2438 metre long main runway was completed 
  • 1981 - the new international terminal was opened and B747 flights commenced
  • 1986 - the present runway was resurfaced
  • 2003 - the second stage of the airport terminal redevelopment was completed
I wonder if any of this is reflected in this graph from the BoM, particularly the pronounced uptick from the mid-1980s?


By comparison, when we look at the same graph for sleepy seaside Cardwell, 135km north of Townsville, what do we see?


Can you believe it? Pronounced cooling over the same period. Apparently we can have Global Warming in Townsville, while we simultaneously have Global Cooling a mere 135km away. Amazing.

Eloi's First Law of Climate Science: "No Airport - No Global Warming".

Monday, March 22, 2010

The NSW Regional Airports

In this installment, we look at the remaining regional NSW airports that host weather stations for the RCS network. They are:
  1. 053115 - Moree Airport
  2. 060139 - Port Macquarie Airport
  3. 060141 - Taree Airport
  4. 072150 - Wagga Airport
  5. 074258 - Deniliquin Airport
A couple of important issues which this examination raises are: just what is the Australian BoM's definition of a "large urban centre", and what impact does siting a weather station adjacent to an airport runway have on "high quality" climate records?  In all of these examples, we see that the weather stations have been located within an airport perimiter - and close to residential housing. Surely "Climate Science" can't be a totally standards-free endeavour?

In addition we see that (again) all of these sites have been photographed in such a way that none of this surrounding environment is apparent.

Moree Airport (1995)

Official BoM photograph:


Google Earth view:


Port Macquarie (1995)

Official BoM photograph:


Google Earth view:


Taree (1997)

Official BoM photograph:


Google Earth view:


Incidentally, this site would not be CRN1-compliant due to the station being less than 100m from the runway.
 
Wagga (1941)
 
Official BoM photograph:


Google Earth view:


This site also likely fails CRN1 status due to the proximity of the building and ashphalted car park.
 
Deniliquin (1997)
 
Official BoM photograph:


Google Earth view:


Summary:
We are now nearly at the quarter-way mark (23 out of 103) and are yet to find a station which clearly meets the twin objectives of high-quality siting away from urban population centres. What a disappointment!

Update:
I notice that his investigation has been mentioned by Andrew Bolt's blog, TWAWKI blog, Watts Up With That blog, and Australian Climate Madness blog. It is my understanding that in the world of "Climate Science" this entitles me to claim "robust, peer reviewed" status for this investigation.

Sunday, March 21, 2010

The Dodgy Post Offices

Next to airports, an historical location for weather stations has been post office buildings, and this is the next category of "high quality, long-term climate monitoring" stations under examination. When looking at the examples provided below, it is worth keeping in mind that stations such as these have been at the forefront of developing the narrative that global warming is real, is happening faster than we previously thought, and that man's contribution to this impending disaster is unequivocal.

The RCS stations surveyed in this installment include:
  1. 008039 - Dalwallinu (WA)
  2. 009510 - Bridgetown Post Office (WA)
  3. 010035 - Cunderdin (WA)
  4. 026026 - Robe (SA)
  5. 037051 - Winton Post Office (Qld)
  6. 073054 - Wyalong Post Office (NSW)
In these instances, there is no need for additional investigation with Google Earth. The BoM photos well and truly speak for themselves. This installment should therefore more appropriately be entitled "Spot the Deliberate Errors".

Dalwallinu (1912)


How many CRN1 criteria does this site meet?
  • Flat horizontal ground surrounded by a clear surface ?
  • Grass/low vegetation ground cover <10 centimeters high ?
  • 100m from buildings ?
The short answer is: probably none. CRN1 status: Fail.

Bridgetown Post Office (1887)


You've got to love this one - sitting in a back yard surrounded by tall brick buildings. CRN1 status: Fail.

Cunderdin (1914)


This has to be one of the favourites so far - the station is just dumped in a lot along with corrugated iron fences and builders' rubble. CRN1 status: Fail.

Robe (1860)


It looks like the original building is gone, and the station is now surrounded by what looks like a steel fence on all sides. A check of Google Earth also shows that there are sealed roads on three sides, all at less than 50m distance. If the photographer had stood at the other end to take the picture, you would also see that the ocean is roughly 60m in the background. CRN1 status: Fail.

Winton Post Office (1884)


Anyone see any problems here? Other than being next to a building with a tin roof, a concrete parking bay, an asphalted road, and behind a shade bush? Not sure what the water sprinkler contributes to the overall accuracy, either. CRN1 status: Fail.

Wyalong Post Office (1895)


Is there anything right about this picture? On an ungrassed surface, next to what looks like a steel fence, behind a building with an air conditioner unit on the roof and paved walkways? A "high quality" climate data gathering station? (A quick check of the BoM site shows that this station appears to be missing data between 1957-1965). CRN1 status: Fail.

Summary:
We have now looked at 18 separate stations (out of a total of 103), in three separate categories. So far, not one of these stations meets the criteria of being "away from large urban centres" and the CRN quality standards of NOAA/NCDC in terms of siting.

Unless there is a dramatic improvement in the remaining 85 stations, we would be well justified in asking the questions: "Just how reliable is the RCS network data and how valid are any conclusions that are drawn from them"?