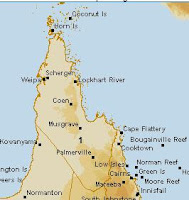
Presumably the fact that it is located at an airport gives it preferential treatment:
- 51 of the 103 stations (49.5%) in the RCS Network are located at airports or airstrips
- 11 of the 18 RCS stations (61.1%) in Queensland are located at airports or airstrips
- 60 of the 134 stations (44.8%) currently active in Queensland are located at airports or airstrips
The other seven stations in Peninsula District are:
027054 - Coconut Island - [data] [graph]
027058 - Horn Island - [data] [graph]
027073 - Coen Airport - [data] [graph]
027075 - Scherger RAAF - [data] [graph]
028004 - Palmerville - [data] [graph]
028007 - Musgrave - [data] [graph]
028008 - Lockhart River Airport - [data] [graph]
On the surface of it, Weipa Airport seems to meet none of the qualifications for a "high quality, long term" station.
1. It is sited next to an airstrip
2. It is missing most of its data
3. But for the few years that it has been collecting data, it does have a slight warming trend.
Of the remaining airport stations, five (027054 - Coconut Island, 027058 - Horn Island, 027073 - Coen Airport, 027075 - Scherger RAAF, 028004 - Palmerville) have less years of data than Weipa Airport, and are therefore less suitable candidates.
The sixth (028007 - Musgrave) has most of its data missing, and is therefore even less suitable.
028008 - Lockhart River Airport has far more years of data than Weipa Airport, but unfortunately it would seem to support a different narrative - namely 40 years of temperature stability:
By far the best candidate is the remaining non-airport station, 028004 - Palmerville. Its qualifications are:
1. Situated in a rural location, with no apparent contamination from human habitation or machinery:
2. A long term, almost complete set of data:
3. Unfortunately, like Lockhart River Airport, it also tells the wrong narrative - over a century of temperature stability:
Summary:
Weipa Airport could not be more untypical of the stations that the RCS claims to represent, namely "high quality, long term" records. The only two stations in this District which, on the surface of it, appear to more fully satisfy these requirments have been passed over - presumably because they support a different narrative. Unless there is another explanation, this would appear to be blatant cherry-picking of the worst kind. But then - why hasn't this been picked up by the "peer review"?


.png)


.png)
Hi Eloi
ReplyDeleteThere could be another source of positive bias in the trends. In the old days all of the weather stations had the data recorded manually at defined intervals and the daily maximum was the highest of those readings. Now a lot of stations are automated, and from what I can gather the highest temp for the day is often a spike between the half hourly data. Recently I have been looking closely at the daily maximums as compared to the half hourly data for my local AWS at Warrnambool Airport on the BOM website. On numerous occasions the daily max is higher than any of the half hourly readings.
I noticed with Observatory Hill in Sydney - particularly on very cold days the temperature there would mysteriously jump up a degree or two if it was about to set a cold record. When I looked at the data for the same time over the other suburban stations this didnt happen. End result cold records simply didnt happen/vanished. You gotta make sure if seems like its getting warmer even though we're freezing.
ReplyDeleteThe 1992 start for data from Weipa is very interesting. According to many surface stations round Australia and elsewhere in the world, 1988 was a relatively hot year as the graph for Lockhart River also shows, but there was a sharp cooling for the next four years after the Mt. Pinatuba eruption. 1992 was the low point in Australia so no wonder the Weipa graph to 2009 shows a slight warming trend.
ReplyDeleteIncidentally, 1992 was also the year of the "Great Dying of Thermometers" used by NASA's GISS for data from Australia, when 401 of the 465 stations previously used, were dropped!
A further point on 1988 is that in Tasmania, that year still shows as the hottest since 1961 at nearly all surface stations according to the GISTemp graphs, even exceeding the El Nino year in 1998.
Yesterday, Warrnambool Airport highest temp on the half hourly data was 19.3 deg. The official maximum for yesterday was 21 deg. What's going on?
ReplyDelete